Wednesday, 29 April 2020

Conditional Formatting

Conditional Formatting

 
Highlight Cells Rules | Clear Rules | Top/Bottom Rules | Conditional Formatting with Formulas

Conditional formatting in Excel enables you to highlight cells with a certain color, depending on the cell's value.


Highlight Cells Rules


To highlight cells that are greater than a value, execute the following steps.
1. Select the range A1:A10.
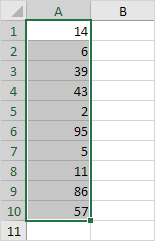
Conditional Formatting Example
2. On the Home tab, in the Styles group, click Conditional Formatting.
Click Conditional Formatting
3. Click Highlight Cells Rules, Greater Than.
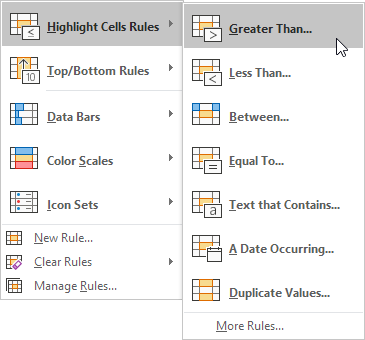
Highlight Cells Rules
4. Enter the value 80 and select a formatting style.
Greater Than
5. Click OK.
Result. Excel highlights the cells that are greater than 80.
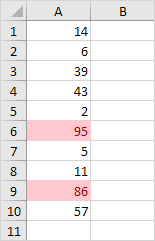
Greater Than Result
6. Change the value of cell A1 to 81.
Result. Excel changes the format of cell A1 automatically.
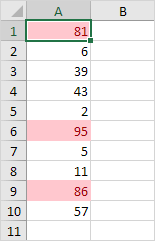
Conditional Formatting in Excel
Note: you can also use this category (see step 3) to highlight cells that are less than a value, between two values, equal to a value, cells that contain specific text, dates (today, last week, next month, etc.), duplicates or unique values.

Clear Rules


To clear a conditional formatting rule, execute the following steps.
1. Select the range A1:A10.
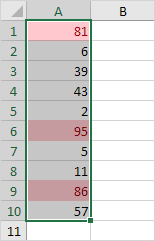
Select Cells
2. On the Home tab, in the Styles group, click Conditional Formatting.
Click Conditional Formatting
3. Click Clear Rules, Clear Rules from Selected Cells.
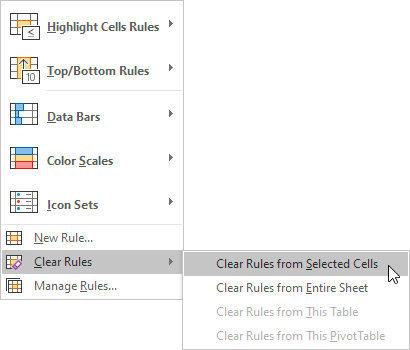
Clear Rules

Top/Bottom Rules


To highlight cells that are above average, execute the following steps.
1. Select the range A1:A10.
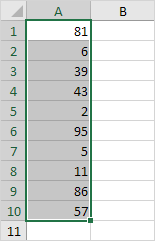
Top/Bottom Rules Example
2. On the Home tab, in the Styles group, click Conditional Formatting.
Click Conditional Formatting
3. Click Top/Bottom Rules, Above Average.
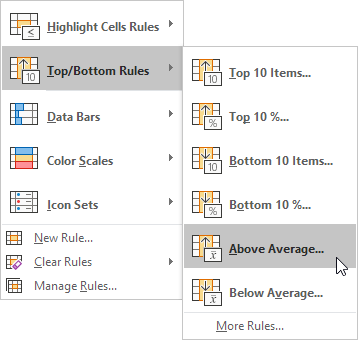
Top/Bottom Rules
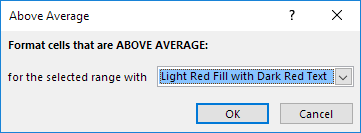
4. Select a formatting style.
Above Average
5. Click OK.
Result. Excel calculates the average (42.5) and formats the cells that are above this average.
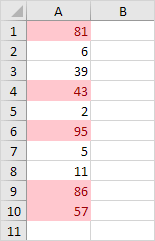
Above Average Result
Note: you can also use this category (see step 3) to highlight the top n items, the top n percent, the bottom n items, the bottom n percent or cells that are below average.


Conditional Formatting with Formulas


Take your Excel skills to the next level and use a formula to determine which cells to format. Formulas that apply conditional formatting must evaluate to TRUE or FALSE.
1. Select the range A1:E5.
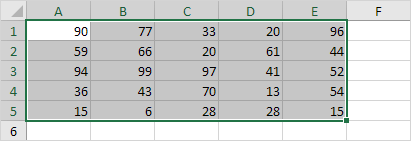
Cells to Format
2. On the Home tab, in the Styles group, click Conditional Formatting.
Click Conditional Formatting
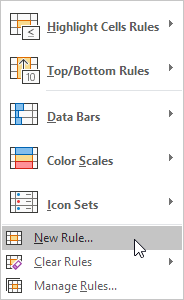
3. Click New Rule.
Click New Rule
4. Select 'Use a formula to determine which cells to format'.
5. Enter the formula =ISODD(A1)
6. Select a formatting style and click OK.
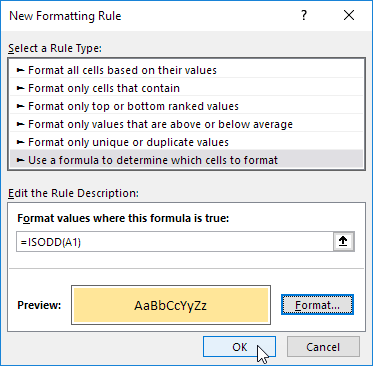
Use a formula to determine which cells to format
Result. Excel highlights all odd numbers.
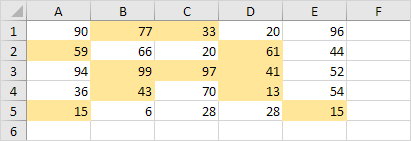
Odd Numbers
Explanation: always write the formula for the upper-left cell in the selected range. Excel automatically copies the formula to the other cells. Thus, cell A2 contains the formula =ISODD(A2), cell A3 contains the formula =ISODD(A3), etc.
Here's another example.
7. Select the range A2:D7.
Select Range
8. Repeat steps 2-4 above.
9. Enter the formula =$C2="USA"
10. Select a formatting style and click OK.
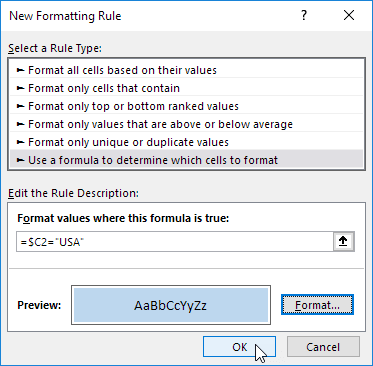
Format values where this formula is true
Result. Excel highlights all USA orders.
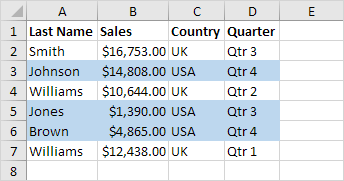
Conditional Formatting with a Formula
Explanation: we fixed the reference to column C by placing a $ symbol in front of the column letter ($C2). As a result, cell B2, C2 and cell D2 also contain the formula =$C2="USA", cell A3, B3, C3 and D3 contain the formula =$C3="USA", etc.

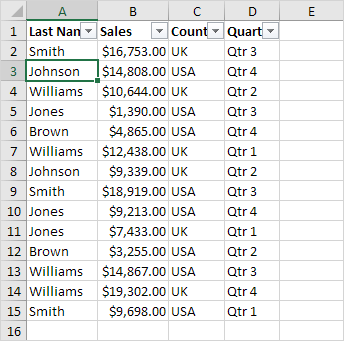
Filter in Excel

Filter

 
Filter your Excel data if you only want to display records that meet certain criteria.
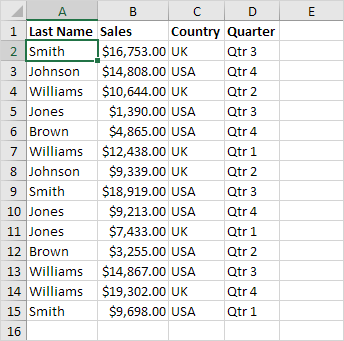
1. Click any single cell inside a data set.
2. On the Data tab, in the Sort & Filter group, click Filter.
Filter Example
Arrows in the column headers appear.
Filter Arrrows
3. Click the arrow next to Country.
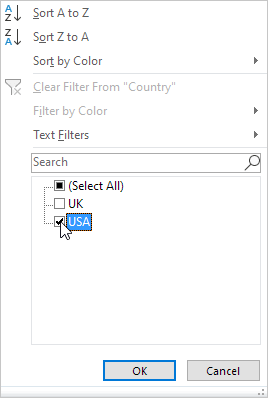
4. Click on Select All to clear all the check boxes, and click the check box next to USA.
Click USA
5. Click OK.
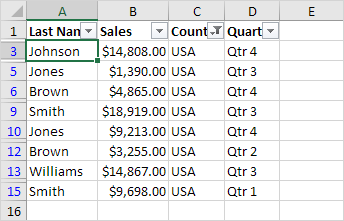
Result. Excel only displays the sales in the USA.
Filter in Excel
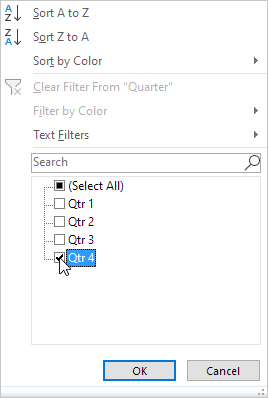
6. Click the arrow next to Quarter.
7. Click on Select All to clear all the check boxes, and click the check box next to Qtr 4.
Click Qtr 4
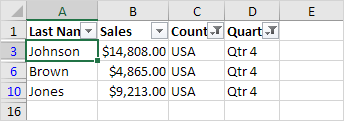
8. Click OK.
Result. Excel only displays the sales in the USA in Qtr 4.
Filter in Excel
9. To remove the filter, on the Data tab, in the Sort & Filter group, click Clear. To remove the filter and the arrows, click Filter.
Clear Filter

Sorting in Excel

Sorting in Excel

One Column | Multiple Columns
You can sort your Excel data on one column or multiple columns. You can sort in ascending or descending order.

One Column


To sort on one column, execute the following steps.
1. Click any cell in the column you want to sort.

Sort on One Column Example
2. To sort in ascending order, on the Data tab, in the Sort & Filter group, click AZ.

Sort in Ascending Order
Result:
Sort on one Column in Excel
Note: to sort in descending order, click ZA.


Multiple Columns


To sort on multiple columns, execute the following steps.
1. On the Data tab, in the Sort & Filter group, click Sort.
Click Sort
The Sort dialog box appears.
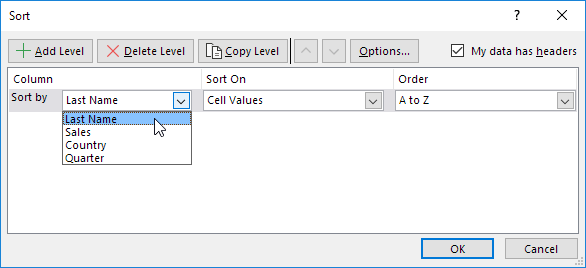
2. Select Last Name from the 'Sort by' drop-down list.
Sort by
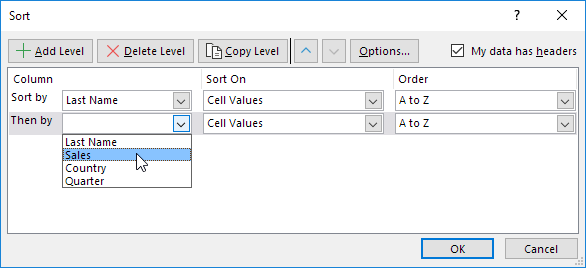
3. Click on Add Level.
4. Select Sales from the 'Then by' drop-down list.
Then by
5. Click OK.
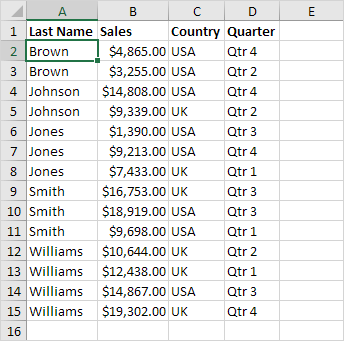
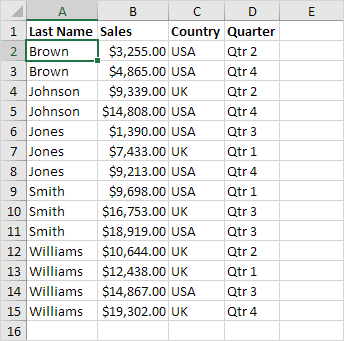
Result. Records are sorted by Last Name first and Sales second.
Sort On Multiple Columns in Excel

Tuesday, 28 April 2020

Excel - How to Protect Excel

Protect Excel Sheet


Encrypt an Excel file with a password so that it requires a password to open it. To password protect an Excel file, execute the following steps.

1. Open an Excel file.
2. On the File tab, click Save As.
3. Click Browse.
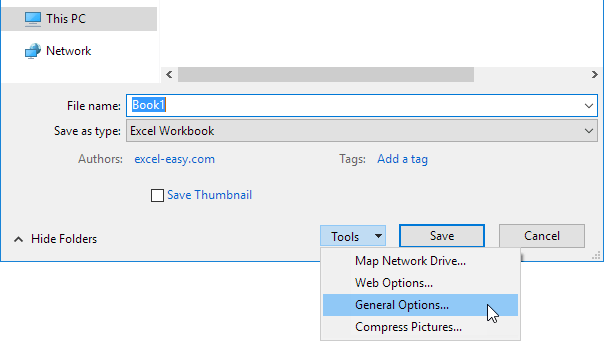
4. Click on the Tools button and click General Options.
Tools, General Options
5. In the Password to open box, enter a password and click OK.
Enter a Password
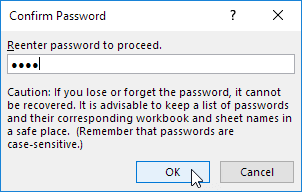
6. Reenter the password and click OK.
Reenter the Password
Note: this feature also encrypts your Excel file. If you lose or forget the password, it cannot be recovered.
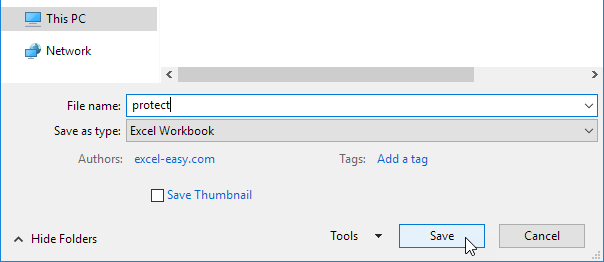
7. Enter a file name and click Save.
Click Save
It requires a password to open this Excel file now. The password for the downloadable Excel file is "easy".

Excel - Sumproduct

Sumproduct

Basic Use | Advanced Use
To calculate the sum of the products of corresponding numbers in one or more ranges, use Excel's powerful SUMPRODUCT function.

Basic Use


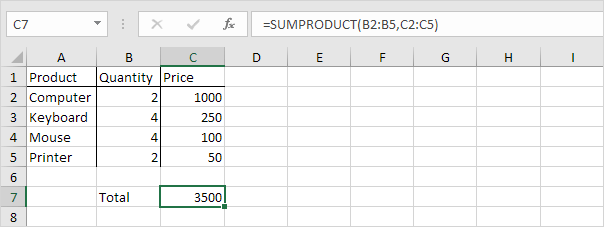
1. For example, the SUMPRODUCT function below calculates the total amount spent.
Sumproduct Function in Excel

Explanation: the SUMPRODUCT function performs this calculation: (2 * 1000) + (4 * 250) + (4 * 100) + (2 * 50) = 3500.
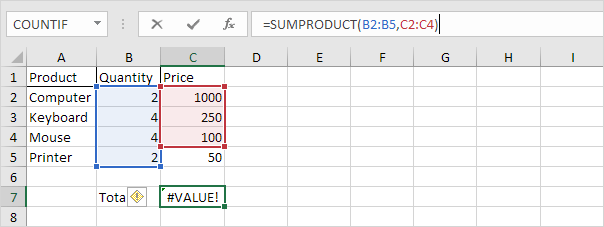
2. The ranges must have the same dimensions or Excel will display the #VALUE! error.
Ranges of Unequal Size
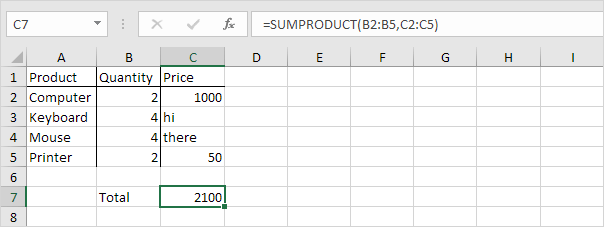
3. The SUMPRODUCT function treats any entries that are not numeric as if they were zeros.
Non Numeric Entries
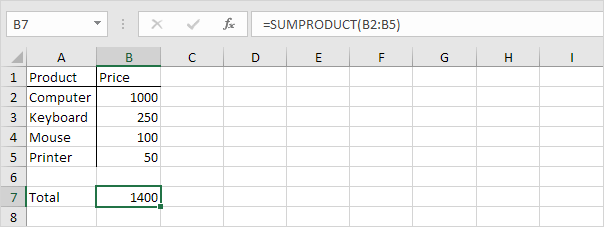
4. If you supply a single range, the SUMPRODUCT function produces the exact same result as the SUM function.
One Range


Advanced Use


The SUMPRODUCT function is an extremely versatile function and can produce the same result as many built-in functions in Excel and even array formulas!
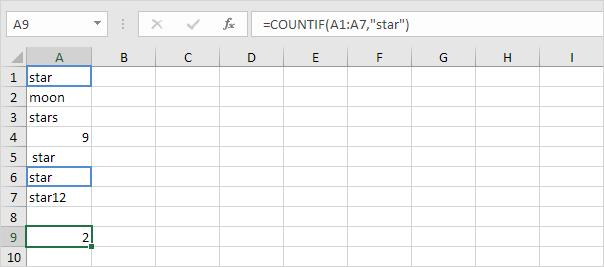
1a. For example, the COUNTIF function below counts the number of cells that contain exactly star.
Countif Function
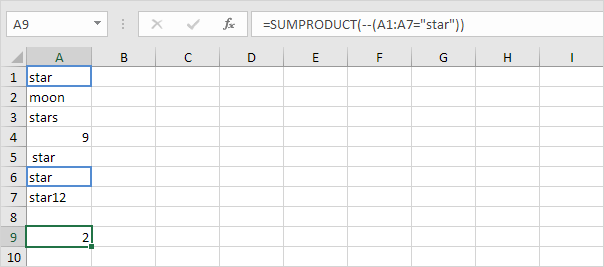
1b. The SUMPRODUCT function below produces the exact same result.
Double Negative
Explanation: --(A1:A7="star") reduces to the following array constant:
--{TRUE;FALSE;FALSE;FALSE;FALSE;TRUE;FALSE}
The double negative -- coerces these Booleans to 1's and 0's (TRUE=1, FALSE=0). Result:
{1;0;0;0;0;1;0}
This array constant is used as an argument for the SUMPRODUCT function, giving a result of 2.
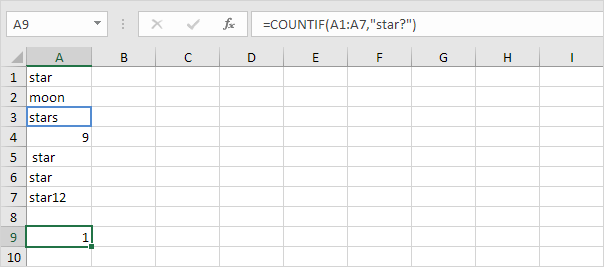
1c. The COUNTIF function below counts the number of cells that contain exactly star + 1 character. A question mark (?) matches exactly one character.
Wildcard Character
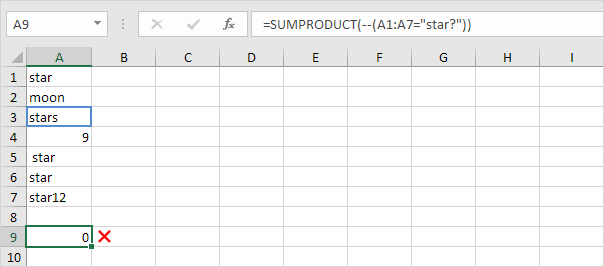
1d. The SUMPRODUCT function is not perfect! You cannot use wildcard characters (? and *) when you use the SUMPRODUCT function.
Sumproduct Limitation
2a. The array formula below counts the number of characters in a range of cells.
Count Characters
Note: finish an array formula by pressing CTRL + SHIFT + ENTER. Excel adds the curly braces {}.
2b. The SUMPRODUCT function below produces the exact same result.
Elegant Sumproduct Formula
Note: the array constant {9;4;6;5} is used as an argument for the SUMPRODUCT function, giving a result of 24. The SUMPRODUCT function handles arrays natively so you don't have to finish by pressing CTRL + SHIFT + ENTER. This is one of the biggest advantages of the SUMPRODUCT function because the curly braces {} confuse many Excel beginners!
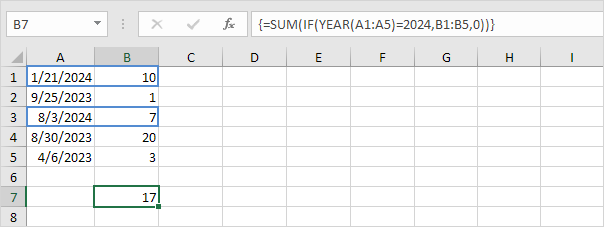
3a. The array formula below sums the sales in 2018.
Sum by Year
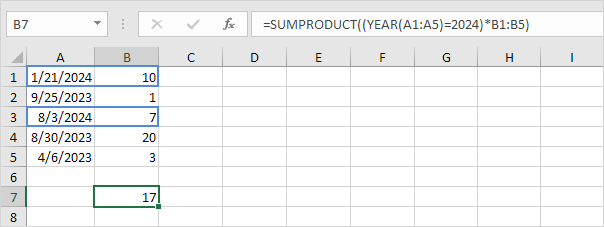
3b. The SUMPRODUCT function below produces the exact same result.
Multiplication Operator
Explanation: (YEAR(A1:A5)=2018)*B1:B5 reduces to:
({2018;2017;2018;2017;2017}=2018)*{10;1;7;20;3} and this reduces to:
{TRUE;FALSE;TRUE;FALSE;FALSE}*{10;1;7;20;3}
We don't need a double negative (see example 1b) because the multiplication operator * automatically coerces the Booleans to 1's and 0's (TRUE=1, FALSE=0). Result:
{10;0;7;0;0}
This array constant is used as an argument for the SUMPRODUCT function, giving a result of 17.

More Excel Functions

Conditional Formatting

Conditional Formatting   Highlight Cells Rules | Clear Rules | Top/Bottom Rules | Conditional Formatting with Formulas Cond...